Determining Design Values for Lumber
Recently, we shared a blog discussing the various types of lumber strength properties. These are important for engineers to use to design structure with wood. But where do the lumber design values come from? The process of determining lumber design values has evolved over the years.
Originally, people building structures from wood used a trial and error method. Experienced carpenters knew from experience what size of members were needed in certain applications to build a structure that would hold up. In the early 1900’s, grading rules were developed so lumber could be graded consistently. In general, pieces with smaller knots are usually stronger than pieces with larger knots. Pieces with more, closely-spaced growth rings were usually stronger than pieces with fewer, widely-spaced growth rings.
Early testing standards were written that showed how to test “small, clear specimens” (i.e. 2”x2”x28”) to determine the “clear wood strength” of various species of wood. Other standards were written that then reduced the clear wood strength for the magnitude of certain defects (knots, holes, slope of grain, etc.) for the sizes of defects permitted in each grade. This system worked reasonably well, especially considering that equipment to test full-size pieces of lumber and timbers were not readily available. Additional standards were published that gave guidance on how to combine data from a number of different species and ensure that the design values were appropriate for any lumber from that grouping. The published design values were not based on the average strength of the pieces tested, but a statistical value called the “5th percentile”. The 5th percentile is that value which 95% of the pieces are stronger than. Furthermore, a significant factor of safety is applied to further reduce the published design values so that accidental overloads and statistically unlikely situations do not result in structure failures.
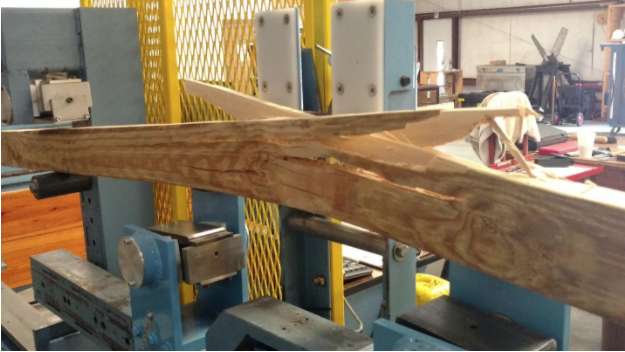
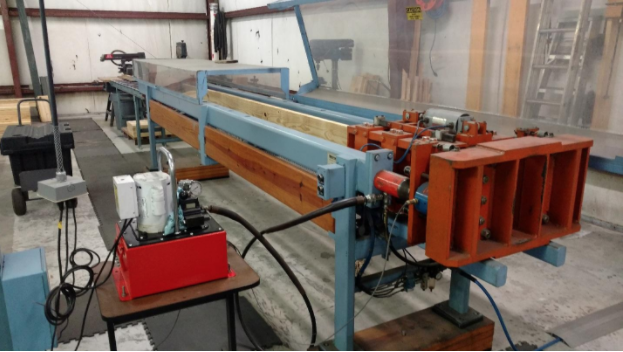
This system worked reasonably well, but as technology and machine design advanced, it became possible to test full-size pieces of graded lumber and determine the strength values in several of the various modes (bending, tension, compression parallel to grain). Figures 1 and 2 show the testing equipment currently used by SPIB to conduct tests for bending strength and tension strength of full-size dimension lumber.

Figure 1. Specimen loaded to failure in bending.

Figure 2. Tension testing machine used by SPIB.
The largest program for testing full-size pieces of lumber was undertaken by the US and Canadian grading agencies, in cooperation with the USDA Forest Products lab in the late 1970’s and early 1980’s. New standards were written so that testing could be conducted consistently across North America with portable testing machines taken to sawmill facilities. Samples of lumber were randomly selected from mills that had been assigned to homogeneous growing regions across the entire growth region of each of the major lumber species. The samples were pulled in proportion to the production from each of those growing regions. Again, statistics were used to ensure that a strength value representative of the 5th percentile of the pieces tested was used and a factor of safety further reduced the published values. Rules for how to combine data from various sizes of tested lumber, as well as rules for combining data from various species of lumber, were documented in ASTM standards. Many North American technical experts from grading agencies, lumber industry members, USDA FPL, academia, and lumber users came together to develop these standards. The “new” design values for structural lumber were published in 1991. There were some changes in some of the values due to the new methodology, but in general, the conclusion was that the original system was reasonably accurate.
Design values for other sizes and certain grades of timbers and lumber are still based on the original system of reducing the clear wood strength for the particular characteristics permitted in each grade.

